Back to Research & Publication
Wildfire

Introduction
In recent years, incidents and severity of wildfires in California have been rising. While a fundamental factor for this trend is climate change. Global warming, however, is happening to the entire world, and California seems to suffer from an unusually detrimental impact. Why are wildfires in California especially getting worse so quickly? This question motivated me to examine other possible causes for wildfires in California.
Interestingly, about 97% of fires in coastal California are started by people whereas for other states, the most common causes are debris burning or lightning. Furthermore, one important fire risk in California is Wildland Urban Interface (WUI) - an area where human made structures and infrastructure (such as cell towers, schools, water supply facilities, etc.) are in or adjacent to areas prone to wildfire. To my surprise, WUIs do not only exist in California; many states on the East Coast also contain WUIs. It is possible that WUIs in California are a more significant cause of wildfires because more people live in these high risk areas since expensive housing prices in urban areas such as the Bay Area push people to migrate out of cities.
In order to gain some insights into the human interaction in WUI, this study asks the questions: how are the Wildland Urban Interface different in California compared to other states in terms of housing density? Does that difference explain the increasing number of wildfire incidents in California in recent years?
This study will compare wildfire and housing density data from California with another state that has similar climate as California. Since the nature aspects of the two states are similar, we can further narrow down the cause of the wildfire difference between them and study the correlation between fires and housing density. After comparing annual rainfall, temperature and humidity cycles, I decided to use Georgia as a comparison for California in this study. Initially, I wanted to narrow down the scope of the study to a handful of counties in both states instead of averaging across the entire state for better specificity. Due to constraints of the dataset, however, I ended up comparing aggregated data from each of the two states instead of using individual county data from the states. It was clear that California has higher housing density and bigger wildfire size compared to Georgia. With housing density as the independent variable and fire size as the dependent variable, I fit a linear regression model for each state. For both Georgia and California, there was a positive correlation (r = 0.7 for Georgia, r = 0.8 for California) between housing density and average wildfire size. While there is not enough evidence to determine a causal relationship between the two variables, it is sufficient to suggest the possibility of a correlation between them.
Data Analysis
- Another sentence or two on specifics of choosing Georgia. Difference mainly in the winter. Very similar average temperatures and humidity during fire season.
- Kaggle dataset of 1.88 Million US Wildfires from 1992 to 2015. Read the SQL database. Only imported CA and GA data. Also had to select columns since the kernel could not handle all 51 columns.
- Closer look at all 51 columns. Many repetitive categories such as different ID for each fire such as “local_firereport_id”, “ICS209_incident number” (ICS-209 report used by Federal Emergency Management Agency)
- Took “FOD_ID” the global unique identifier as the index. Selected columns: fire_year, discovery_date, fire_size, fire_size_class, county, state
- Reasons for selecting data: complete data from government agencies. CalFire and other government agencies would have summarized data about annual averages. Not as specific as this kaggle dataset. Also good to get data for both states from the same source, consistent measurement scale
- Difficulties with county data: missing data (40% of county missing, would make a significant impact if simply discard those data), nonsense county codes that were out of range
- Made a decision to look at state aggregate. Although would not be as specific as county data, it can provide some insight into the relationship between housing and fire
- US census data for housing density, population / housing units. Only data from 2010 - 2019
- Government data was easy to process, and very recent, but the timeframe was short
Visualizations

Normalized fire size. Divided the average fire size by size of state since California is bigger than Georgia
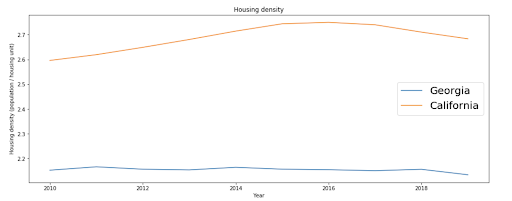
Housing density, calculated by population / housing unit

Housing density and average fire size in California. Both show an upward trend

Note the interesting pattern, after 2011, bad year of fire, housing density drop. Do not go up like california
Also note the absolute value of the scales in both graphs, Georgia has lower housing density
Limits and future plans
- Aggregated wildfire and housing density data on a state level
- Only included data from recent years
- Neglected data from missing and unclear county categories
- Find a more complete dataset or contact the database organizer for information about the missing/ambiguous data
- Expand the analysis to include a wider time range
- Put a heavier emphasis on WUI exploration. Focus on housing density in the WUI
Conclusion
- On average, California suffer from larger wildfires than Georgia. In addition, in terms of statewide average, California has higher housing density than Georgia
- Simple linear regression of housing density and average wildfire size
- r_ca = 0.8, r_ga = 0.7. Positive correlation
- Correlation does not mean causation. Also there were many flaws and limitations in the dataset
- But it is enough to propose the possibility of a relationship between the two variables for further detailed investigation
Semester
Fall 2020
Researcher
Jade Pan