Back to Research & Publication
Food Allergen Classification

Introduction
Growing up with food allergies, eating out became a laborious and mostly avoided occurrence. Hearing the server tell you all about the restaurant’s nightly special while zoning out and anxiously wondering whether or not there’s treenuts contained in the dish. Double checking my bag to make sure my Epipen and Benadryl were ready to go, just in case. In an ideal world, I wouldn’t have any of these worries, but unfortunately my data science skills have not evolved to include advanced immunology.
Fueled by the above sentiment, I sought to build a classifier which could predict which allergens may be contained in a restaurant menu item based upon its title. Unfortunately, the wide variance in online menu formatting made it difficult to collect a large scale amount of data. Thus, I scaled down this issue and decided to focus my project on online food recipes. With a quick scroll through a recipe site, I quickly found hidden allergens around every corner. Eggs in a chicken dish-- really?! In this project, I sought to build a model which can accurately predict which common food allergens are contained in a recipe based upon the title of the recipe.
To perform this, I utilized Jupyter Notebooks, with code written in Python. Within all of this, I used Sci-Kit learn packages intended for word-based machine learning classification. Sci-Kit Learn was incredibly useful in advancing my project, as it has many built in features that concisely analyze text data and build an accurate classifier for each food allergen.
Data Analysis and Visualizations
To build the desired classifier, I needed a dataset which had recipe titles and allergens for each recipe. I sifted through many existing datasets but was unable to find anything suitable. Thus, I set about to make my own dataset. To do so, I performed web scraping on food.ndtv.com to quickly extract a large quantity of recipes. Without going into great detail, web scraping entails extracting certain chunks of text or graphics from a webpage, and is highly scalable, such that after writing code to “scrape” information for one recipe, you can easily loop through and get parallel information for thousands of other pages. The following graphic illustrates the steps taken by the web scraping code to ultimately pull the necessary data from each recipe page.

In totality, I scraped about 1900 recipes, and for each one I extracted the recipe title and ingredient list. Why the ingredient list you may ask? Well, I needed allergens that were contained in each recipe, and I surmised that the easiest way to do so would be to extract the ingredients list from each recipe and then cross reference that with an allergen list corresponding to each ingredient. I also had to self-cultivate the allergen list , which I did by looking through various web sources to find the common ingredients that contained each allergen, as well as more obscure ingredients that had an allergen tied to them. The following image shows each allergen, as well as a small fraction of the ingredients associated with each allergen.

There were several facets of this project that led the classifier to potentially be less accurate than desired. Since I curated the data myself, I could not account for all possible allergen names. Thus, it’s possible that some allergen-ingredient name connections slipped through the cracks (meaning some allergens were potentially not included). Additionally, to determine the allergens, I split and parsed the ingredients and joined with the allergen list. Thus, ingredients composed of several words may have been split up which potentially devoid them of meaning. For example with “split pea soup,” the parsed out word “split” has little meaning. The classifier that I chose to use is called a Naive Bayes Classifier. To explain in its simplest form, this classifier employs the basic principles of Bayes Theorem by assigning a class label to each data point. To use the graph* below as an example, the red dots are all labeled as red by the model, and the green dots are all labeled as green, with the black curve as the boundary line. As is with life, no classifier is perfect, so some green dots are on the true red side and vice versa.
*not my data

I chose to employ a Naive Bayes classifier specifically due to its ability to handle large amounts of data as well as specialized use with predicting categorical data. I implemented a 70/30 train test split, meaning that 70% of the data goes to the training set and 30% to the test set (which will not be touched until the model is being evaluated). I fit and trained a Naive Bayes model using the training data & subsequently used this model to predict the test data. Following this, I looked at various measures and produced graphs of the results to assess model performance. The table below shows the data post-vectorization and prepared for training. The first three rows include identical data since the recipe titles were split into individual words, so “Almond Strawberry Cream” could be trained on each word.

Interpreting the Results
Accuracy: Proportion of correct predictions made by classifier
Precision: Proportion of a recipe strings classified as an allergen that actually contained allergen
- TP/(TP + FP)
Recall: Proportion of whichever recipe strings for which the classifier were correctly identified as containing that allergen.
- TP/(TP+FN)
F1 Score: Function of precision and recall that implies low FP and low FN if it is high itself .
- 2*((precision*recall)/(precision+recall))
Though accuracy is the most commonly used predictor of classifier performance, it is very prone to over and underfitting. Due to this, these other measures can be helpful in determining true model performance. The below graphic shows accuracy, precision, recall and f1 score for each of the 9 allergen classifiers. As you can see, accuracy is fairly high for all of the classifiers, but precision and recall are very low or even zero for some. This highlights the importance of looking at measures other than and in addition to accuracy.

Fairly disappointed with the results depicted in the above graph, I sought to improve the model. Noting that the f1 score (and thus precision and/or recall) was zero for several of the allergens, I decided to investigate the most common predictor words for them. Appalled, I found that the most common predictor word for the sesame model was “and,” as well as “&” and “with” for the shellfish predictor. Though I performed initial filtration of common words such as “recipe,” it was evident that I failed to filter out some extremely common filler words. In addition to poor filtration, it’s important to note the large discrepancy in the allergen to associated number of recipes ratio. Sesame, shellfish, fish, and peanuts were included in very few recipes and thus had significantly fewer data points.

After making some of these model improvements, sesame model precision became non-zero, but shellfish and peanut f1 score, precision and recall all remained zero (shown below).

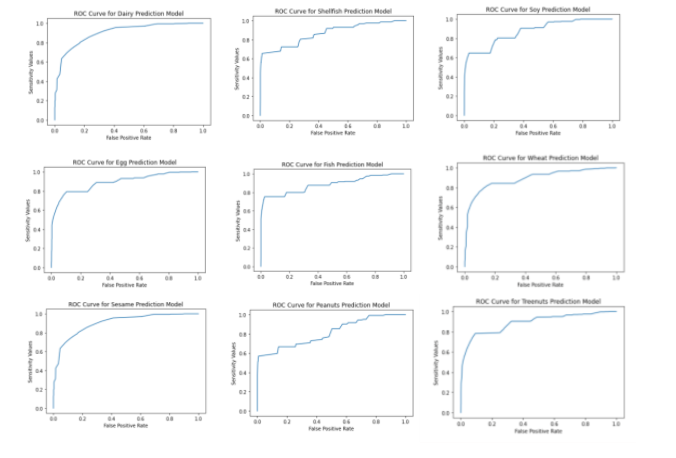
One other metric I used to evaluate each model was an ROC curve. With an ROC curve, smaller values on the x-axis of the plot indicate lower false positive rates, and higher true negative ones, whereas larger values on y-axis of the plot indicate higher true positive values, and lower false negative ones. A perfect ROC curve would be a 90 degree angle in the upper left corner, indicating no false positives and all true positive values. Going off of this metric, the images below show the ROC for each model. Most of the curves are close to the ideal curve--indicative of fairly good models--though the models for peanuts, fish and soy are a bit less accurate.
Conclusion
I was able to build 9 classifiers--one for each of the top 9 allergens-- most of which were able to fairly well predict which allergens were contained in each recipe item (sesame, shellfish, fish, peanuts and soy all had accuracy higher than 90%). Furthermore, by implementing several EDA techniques I was able to improve model performance--as measured by ROC curves, k-fold cross validation, accuracy, and f1 scores-- on several fronts. Generally, there can always be more data, and thus I believe lack of data for some allergens was a hindrance to optimal performance. As mentioned previously, there was a noted lack of data for several allergens, which may have hindered model performance in some cases.
There are several improvements that could surely improve model performance, as well as this study as a whole. One facet I want to improve in future studies is implementing better NLP techniques to improve the allergen list as well as the curated dataset. I manually created those in this study, which leaves room for quite a bit of human error. Furthermore, I want to perhaps use Neural Networks, or just implement a better classifier generally. Though a Naive Bayes classifier was sufficient for my data type and size, there are classifiers which could predict all allergens by fitting just once which is both more efficient and likely produce more reliable results. Finally, I’d like to implement predicting from either more detailed recipe titles or from restaurant menu item descriptions. Ultimately, this study provided a great starting point for future investigations into ingredient and allergen based data.
Semester
Spring 2021
Researcher
Althea Chan