Back to Research & Publication
An Analysis of College Statistics vs Draft and Actual NBA Success Across Different Eras

Introduction
Most players in the NBA come from college basketball, and it is of great importance to NBA franchises to model how various college statistics translate to success in the NBA to determine how to draft college players. As a moderately enthusiastic basketball fan, I am interested in this relationship myself and as such, have kept track of historical trends in draft pick selection and how they change over time. From the mainstream media, I had always heard that wins in college was a surefire indicator of a player's draft position, and therefore success in the NBA—if a player couldn't make his team win in college, against much weaker opposition, then how was he going to lead his team against stronger, smarter, better athletes? However, with Ben Simmons going number 1 overall in the 2016 draft and Markelle Fultz number 1 overall in 2017 draft, with both players' college teams not performing well (Markelle Fultz's University of Washington team even had a below 50% winrate), I was surprised at this seeming departure from the conventional wisdom in recent years.
Based on this admittedly small sample size, I hypothesized that there might be some relationship between the current "era" of the NBA and the influence of a player's college winrate on his draft position. In the modern era, focusing on analytics, three-point shooting, and efficiency, perhaps wins in college were not as important a metric as various other advanced stats, but in previous years, with an emphasis on hand-check defense and post-up play, winrate could've been a more important metric. I decided to test this hypothesis by building my own model.
Methodology
All of my data was scraped from basketball-reference.com and sports-reference.com/cbb using the BeautifulSoup package in Python and Rvest in R. To classify NBA eras, I first compiled a dataframe of NBA season averages of various statistical measures from the 1973-1974 season (the year the 3-point shot first started being tracked) upto the present day:

I then used the apcluster package in R that performs examplar-based affinity propogation, an algorithm that clusters data without being explicitly provided the number of clusters, unlike K-means clustering. Based on the data provided, the algorithm sorted NBA seasons into the following four clusters, to which I've added my own descriptions:

And produced the following heatmap:
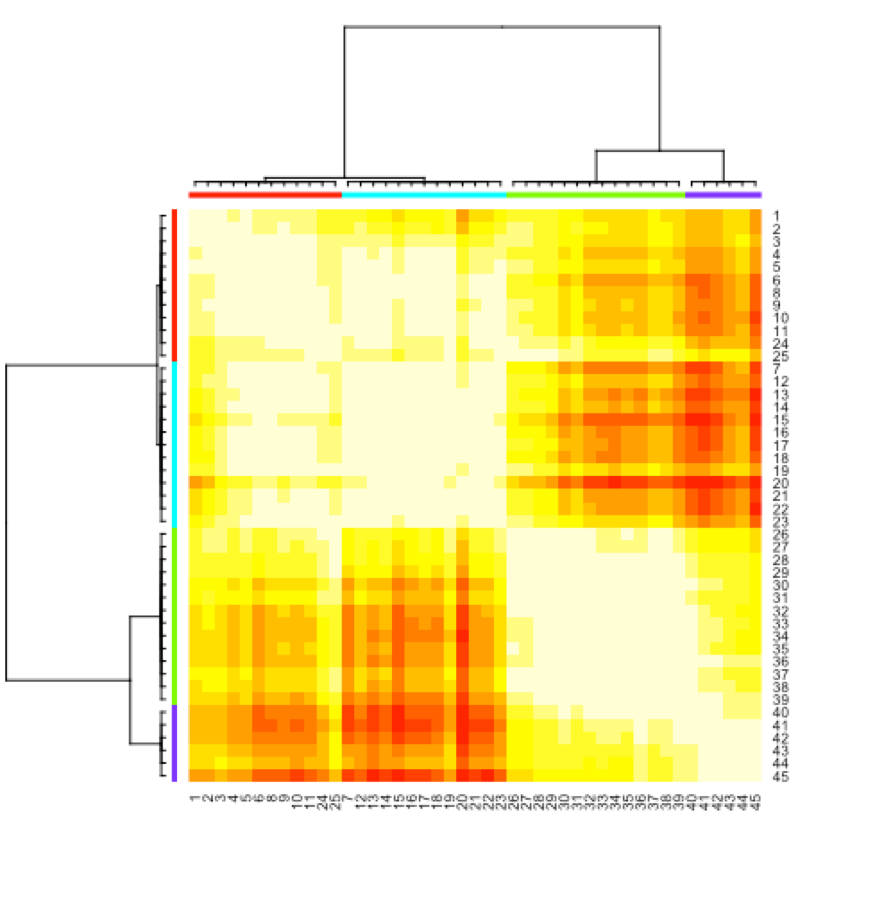
It's interesting to note that most years placed in different eras were in chronological order, with the exception of the 1993, 1994, and 2011 seasons. This makes contextual sense, as 1993-1994 were the seasons with a shorter 3-point line and thus were quite similar to the modern run-and-gun offense, while the 2011-2012 season was a lockout-shortened and injury-ravaged season that had a very slow, defensive style of play, atypical for its era.
Once I obtained rough categorizations for NBA eras, I then scraped player draft data for each season in each era, only looking at the first round draft picks (top 30 picks). For each drafted player who went to college, I scraped their college statistics page on sports-reference.com/cbb to obtain counting stats for their final season in college, and also introduced two additional metrics of my own— their winrate in their final season and the number of seasons they attended college. I then scraped basketball-reference.com to obtain the average winshares per 48 minutes for each of those players during their NBA careers, as a career-length-unbiased estimate of their productivity in the NBA. I further cleaned the data, and then ran a series of 8 regressions using Statsmodels.api in Python—one set for trying to predict the draft position of a player given a set of college parameters for each of the four eras, and the other set for trying to predict a player's winshares per 48 minutes in the NBA given college parameters for each of the four eras. The goal is to observe the relationship between draft position and college statistics (specifically college winrate), see if it varies across eras, and see if there is a similar relationship between college statistics and wins contributed in the NBA.
Results & Analysis
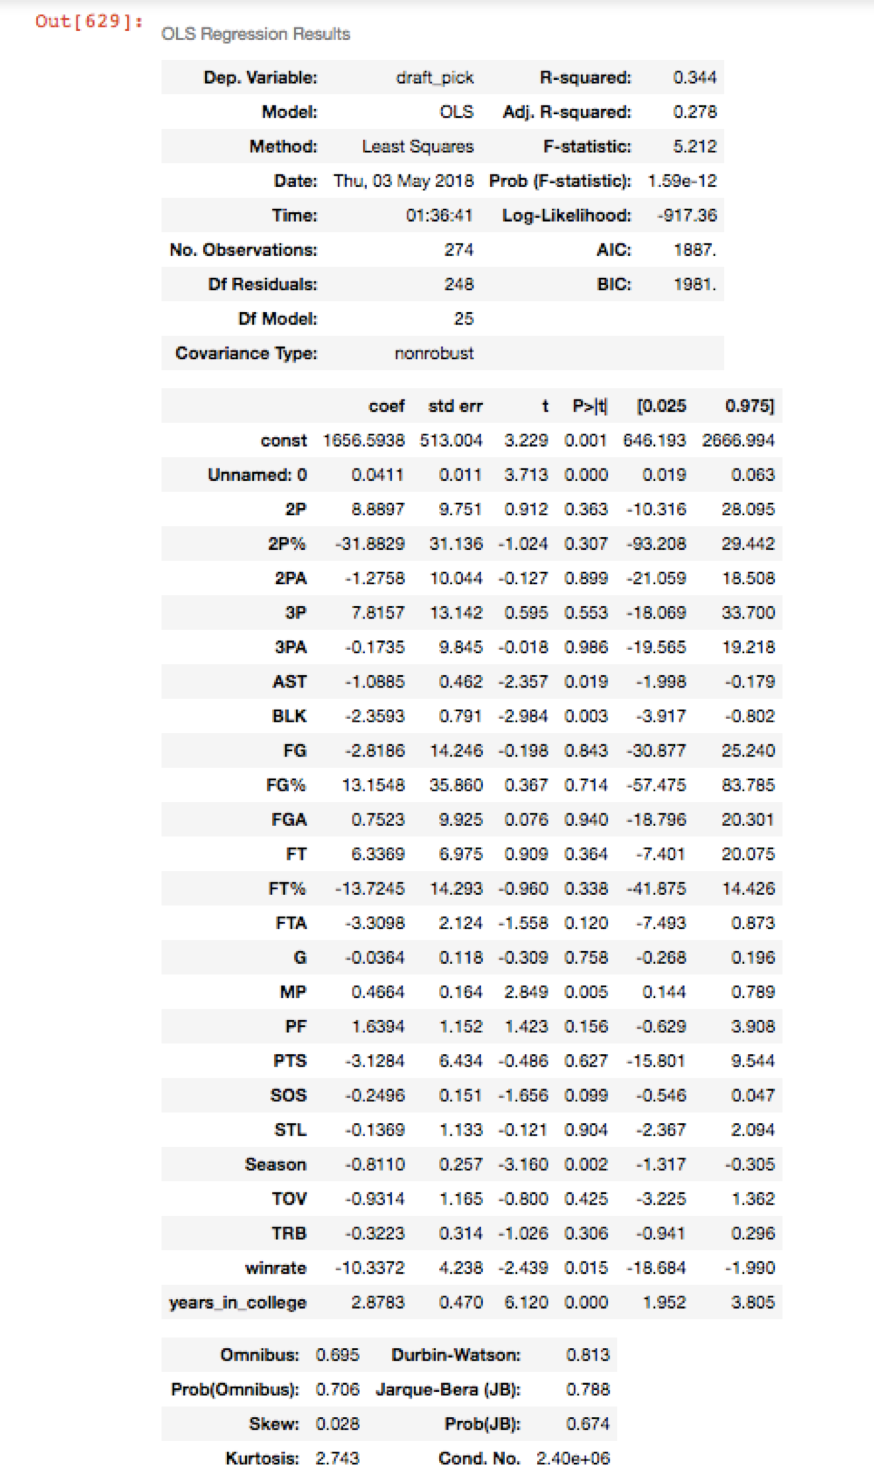
For regression between draft position and college statistics, here are the four regressions
- Era 1 (Dark Ages, Cocaine):
- Era 2 (High Pace Era):
- Era 3 (Athletic Revolution, Low Pace):
- Era 4 (Offensive Evolution):


General Observations:
- In general, the model meets expectations: steals, blocks, points, rebounds, and assists are all negatively related to draft position, meaning the better a player's stats in these categories, the lower (better) his draft position.
- In terms of regular counting stats, blocks seem to be by far the most definitively correlated with draft position (lowest p-value), at least for the last three eras where blocks data was available.
- Percentage field goal categories have consistently lower p-values than their counting stats counterparts, suggesting that having gaudy raw stats is less indicative of high draft position than someone who is selective and efficient with their shots.
- Years in college has as strong a correlation or even higher a correlation than winrate in college for better (lower) draft positions, suggesting that even if a player has not achieved a lot of success in college, if he is young and shows potential, teams are much more likely to pick him than a junior or senior putting up better stats.
- Contrary to my initial hypothesis it seems that, despite the very recent trend against the importance of college winrate led by Markelle Fultz and Ben Simmons, college winrate is about as important a factor as ever when it comes to determining player draft position. In the first two eras the p-values for college winrate were 0.562 and 0.267, which are both not statistically significant. In the last 25 years or so, however, the p-value between winrate and draft position has skyrocketed (so-to-speak) to 0.001 and 0.015, indicating a much more definite correlation that is statistically significant.
For regression between winshares per 48 minutes in the NBA and college statistics, here are the four regressions:
- Era 1 (Dark Ages, Cocaine):
- Era 2 (High Pace Era):
- Era 3 (Athletic Revolution, Low Pace):
- Era 4 (Offensive Evolution):


General Observations:
- Compared to draft position, winshares per 48 minutes has significantly worse p-values across the board, for most statistical measures. This shows that as expected, college success can correlate to draft positions relatively well but it is much harder to predict success in the NBA from college statistics alone.
- For earlier eras, rebounds and blocks had significant correlations to NBA win shares, which qualitatively makes sense because with the high pace, poor shooting and emphasis on defense, both these stats were very relavant to the success of a team at the NBA level.
- For winshares, winrate in college has consistently less significant correlation than years in college, suggesting that this is one aspect that NBA execs get right during the draft—younger players with potential do better in the NBA than older players on better teams.
- In the modern era (2007-Present), only steals (very strong positive correlation) and personal fouls (strong negative correlation) have coefficients in the regression that are statistically significant. This indicates that it is getting harder to determine NBA success through college statistics, especially with the massive difference between modern NBA training and coaching and college coaching. Qualitatively, there seem to be a high number of lottery pick busts in recent times, and conversely many players (such as Kyle Kuzma and Donovan Mitchell from this year's draft) whose college stats didn't stand out and got picked late in the draft but have been tearing it up at the NBA level. NBA general managers have a seriously difficult task on their hands.
College Winrate vs Years in College


These two graphs summarize the data for the two custom metrics (college winrate and years in college) and their correlation to draft position and wins in the NBA. One can see that, with time, the weight for college winrates seem to have increased in the regression for draft position and winshares—that is, a better winrate in college correlates with a relatively better draft position and more wins in the NBA than it did in the past. However, apart from the weight for draft position in Era 3, none of these values have statistically significant p-values, showing that there is high degree of variance in the relationship between college winrate and each of the dependent parameters (draft position and winshares per 48 minutes in the NBA).
In comparison, the correlation values for years in college are decreasing in magnitude over eras, showing that years in college doesn't have as strong a correlation to draft position and wins in the NBA as years past. However, the p-values in recent eras are statistically significant, showing a more definite relationship than college winrate to each of our dependent parameters.
Concluding Thoughts
My analysis of era-based correlation between college statistics and draft position/NBA winrate proved quite fruitful. Some of the most interesting results I found were that, contrary to my initial hypothesis, the strength of correlation between college winrate and draft position increased over time, not decreased as I originally thought. In addition, even though years spent in college does not measure a player's performance or skills in the NBA in any way, it has a more statistically significant correlation to draft position and winshares in the NBA than college winrate does, across most eras. This sort of era-based approach to handling NBA data can be a very useful tool for NBA executives and general managers to see the general drafting patterns that teams have had over time, how those change with trends in eras, and how they can use those trends to better find the players who will perform on their teams at a high level.
Semester
Spring 2018
Researcher
Manan Khattar