Back to Research & Publication
The impact of COVID-19 shutdowns on traffic

Motivation
My original project aimed to look at the geodata for migration over land in order to map routes commonly used for international migration. I spent all of the beginning of my project familiarizing myself with geodata tools and playing around with data for land travel(mostly roads and railways) in order to create a model for travel. While doing this I realized two things. First, it is harder to turn migration data into specific geographic data for the routes people take. Most datasets care about the end destination, but ignore the path in between. I could look at the crossing volume for all of the major border crossings between countries, but that only paints part of the picture as it does not include migration by air or sea. Second, the reason nobody has ever done this sort of careful analysis of land migration is because it does not really matter that much. Obviously, it is interesting to see on a map, but most migration happens by airplane or ship which this sort of thing does not capture. Additionally, there would be a lot of noise in the data. People move around a lot and there was no clear definition of what kind of movement I was looking at. While I was doing all of this, coronavirus was spreading all over the world and schools, offices, and businesses were shutting down. I realized that because of large scale self-quarantining, people were leaving their house less. This means that there would be major changes in traffic patterns and travel by land in general. I decided to change my research question to ask: How have COVID-19 Shutdowns impacted travel by land, specifically traffic in large American cities?
Datasets
There are no easily accessible, current datasets for traffic accident data. I originally planned on using city/county data sets that measured volume based on sensors that detect cars at traffic intersections. The issue with that data was that it was not very current and not well organized. The best traffic data belongs to companies like Apple and Google who use it for their mapping software. Other options include third party datasets aggregated by companies such as TomTom, HERE, and inrix. However, there is a cost barrier for accessing those datasets. My solution was to estimate the volume and spread of traffic using traffic accident data. Cities release public datasets that are updated everyday showing every reported traffic accident and some information about it including geographic coordinates. I used the data from the cities of Los Angeles, Austin, Chicago, and New York City to represent the four regions of this country: West, South, Midwest, and the East.
Objectives
My main objective is to do a comparative analysis for traffic patterns on a small scale. I want to look at traffic patterns before and after COVID-19 shutdowns. I have three hypotheses about how traffic changes due to government shutdowns. I will explore all three in the methodology section:
- I expect the volume of car accidents to decrease with government shutdowns
- I expect the change in frequency of car accidents to be more gradual in cities that have had a slower response to the pandemic, for example Austin, Texas
- I expect the geographic spread of accidents within a city to increase as regions of high traffic will be most dramatically affected by the shutdown
Data Sorting
The data was packaged in a similar way for the four datasets, so I was able to use the same code to organize the data from a CSV file that I downloaded from each city website to a pandas dataframe. First, I normalized the date-time format for each city differently. Then I pulled the 202- data for each city from January 2nd up until the current day. I took data from 2018 and 2019 that matched the dates from 2020. I then split up the 2020 data from before and after the shelter in place orders for each city. I then also split up 2018 and 2019 data for each city with a corresponding date.
Methodology
Volume Analysis
The first thing I did was compare the 2020 data to previous years data. Below I have the graphs of traffic accidents in Austin in early 2018 and early 2020 and a computation for the r2 for linear regressions of both of them.


As you can see, there is a significant decrease in traffic accidents/day around 70 days into the start of 2020. This is also indicated by the much higher r2 value for 2020 of 0.46 as opposed to 0.098 for 2018. This means that a decrease in traffic accidents has a stronger correlation with an increase in days in the year. This is not the most precise analysis for two reasons. First, there is a large spread in the data as the number of accidents in a day can vary greatly. Second, the graph shows that it is not a gradual decrease in accidents, but a quick decrease as shelter in place is instituted. This indicates that it may be better to think of this as categorical data broken down before and after quarantine. Below we do a t-test comparing before and after quarantine 2020 to corresponding dates in 2018 and 2019.

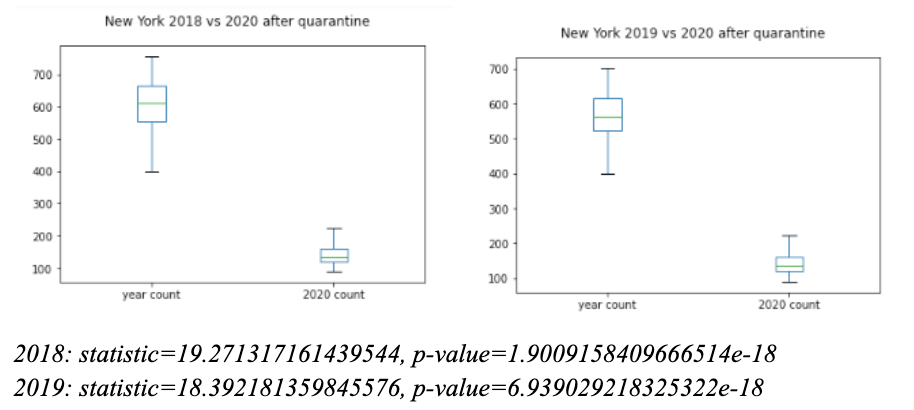
The t-test essentially measures the likelihood that the difference in the two samples can be attributed to chance. While the p-values are small for both before and after quarantine, they are 14 orders of magnitude smaller for the after quarantine comparisons(from 6.59e-4 to 1.903-18 for the comparison between 2018 and 2020). This indicates that shelter in place and quarantine caused a significant change in the volume of traffic accidents. Similar results were found with the data from other cities.
Frequency Comparison
Here I am comparing the number of traffic accidents after quarantine in 2019 and 2020. However, the number is “normalized” by subtracting from a corresponding date before quarantine(or the date equivalent to quarantine in 2019).


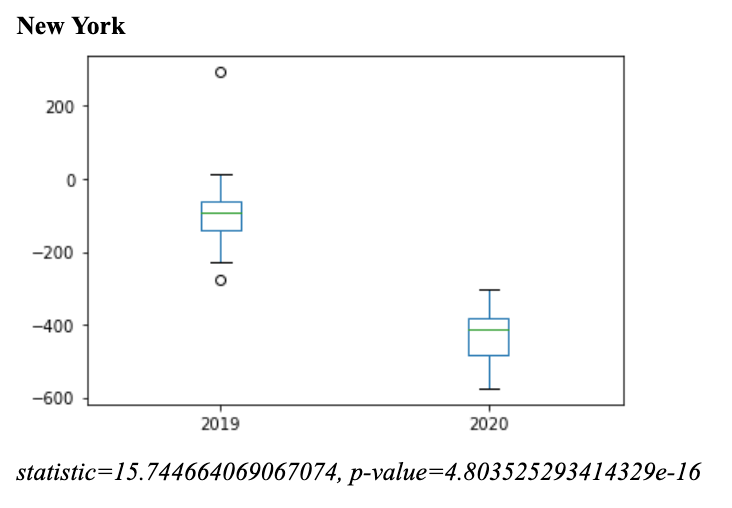

The low p-values confirms that there was a significant difference in traffic accidents due to shelter-in-place orders in 2020. Also, unexpected is that Chicago has the highest p-value and lowest test statistic. This means that Chicago has had the least dramatic change in traffic accidents in 2020. In order to find out why, a closer look at the city of Chicago’s reaction to COVID-19 is needed.
Spread Analysis
To analyze how the spread of traffic accidents changed after COVID-19 quarantine, I am looking at the latitude and longitude of each accident location. I split my data up into before and after quarantine in 2020. I removed anomalies from the dataset. I then separately estimated the mean and standard deviation of the latitude and longitude before and after quarantine using the Python statistics package. I calculated a measure of overall spread using the standard deviations of the latitudes and longitudes with this formula:

Here are my results:


This shows that the spread of accidents increases in every city except for Chicago. Los Angeles has a lower increase in spread, while New York and especially Austin have much larger increases in overall spread after quarantine. I created a joint plot of the latitude and longitude of each city using the Python Seaborn package. I then created a kernel density estimation which estimates the probability of an accident happening at a given coordinate. The darker shaded areas on the graph have a greater probability of an accident occurring there.


These results are very interesting. The spread estimation that was done earlier just tells us that accidents have become more spread out after COVID-19 shutdowns, but it does not tell us where accidents were distributed before and after the shutdowns. We can find that information about distribution from these Kernel density estimates. The common trend between the cities is that before shutdowns, accidents were concentrated in one area, usually the main commercial center of the city. After the coronavirus shutdown, the concentration in the city centers massively decreased and a higher proportion of accidents happened in residential neighbourhoods. In Los Angeles, before shutdown accidents were concentrated around downtown LA and decreasing as you got further away, with a few spots of medium accidents in North LA. After quarantine, the highest concentration of accidents moved further South. Austin has one of the most dramatic shifts. Before, the accidents were heavily concentrated in downtown Austin. Afterwards, accidents are spread throughout the main city pretty evenly. Chicago also has a dramatic shift. Before, accidents were heavily concentrated in the downtown/Chicago loop area. Afterwards, the two largest concentrations of accidents are on the west and south side of the city which are both large residential areas. Similarly, New York goes from having accidents concentrated in lower Manhattan to the two largest concentrations being in Brooklyn and Upper Manhattan/Lower Bronx.
Conclusion/Future Steps
In conclusion, I have answered the three questions that I originally asked:
- I expected the volume of car accidents to decrease with government shutdowns and they did.
- I expected the change in frequency of car accidents to be more gradual in cities that have had a slower response to the pandemic, for example Austin, Texas. Surprisingly this is not the case. Chicago has the least dramatic change in accidents, despite Illinois issuing a stay at home order after Texas
- I expected the geographic spread of accidents within a city to increase as regions of high traffic will be most dramatically affected by the shutdown. This was the case. Every city I looked at except Chicago experienced a higher spread of traffic accidents. Additionally, the distribution of accidents moved from commercial to residential areas in every city that I looked at
In the future, I would like to expand more on the geodata aspect of this project especially measuring the geographic spread of a dataset. I want to incorporate more cities or cities in other countries in this analysis. Additionally, once traffic data for January - April/May 2020 becomes publicly available, I want to compare accident data to traffic data to see if the accident date that I used was actually reliable in indicating the volume and spread of traffic data.
Semester
Spring 2020
Researcher
Amar Shah